Finance and Ownership
Here you'll find the CEO's review, a look at the business environment, and key financial figures.

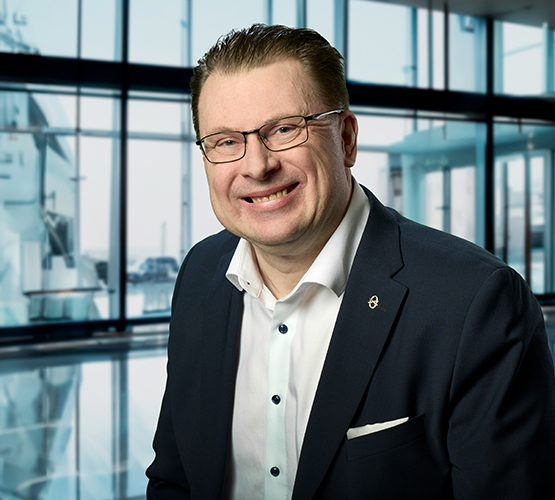
CEO's review
The year 2025 was special for Innofactor, as we celebrated our 25th anniversary at our offices across the Nordic countries. A big thank you to all our customers, partners, and employees who took part! It was fantastic to celebrate Innofactor together with you, as well as my own quarter-century career as an entrepreneur.
Our anniversary year also involved a great deal of wistfulness. Innofactor's more than 14-year journey as a listed company came to an end. During our time as a listed company, we grew strongly in the Nordic countries in accordance with our strategy. Leaving the stock exchange was not an easy step for me personally, but in hindsight, I also see it as unequivocally the best possible solution for the company's success and for its customers, employees, and investors. I want to once again thank everyone who was part of our journey as a listed company!
In 2026, we will continue to invest in leveraging artificial intelligence in organizations' operating processes and in capturing the resulting superior productivity growth, both in our own operations and in those of our customers.
Sami Ensio
Innofactor's founder, major owner, and CEO

Business Environment
We estimate that the Nordic IT services market will continue to grow in 2026, although geopolitical developments and uncertainty surrounding economic growth make precise market forecasts difficult. Price competition remained intense in 2025, particularly in the public sector, but signs of market recovery emerged during the second half of the year.
Generative AI offers our customers significant opportunities to improve operational efficiency and create new business models. We believe that agent-based solutions will become increasingly widespread, and that Innofactor will play a strong role in this development. We are also actively developing AI capabilities for our own products, particularly Dynasty.
Climate change mitigation, rapid technological advancement, and geopolitical shifts are increasing the importance of digital solutions in organizations. At the same time, data sovereignty, cybersecurity, and business continuity are becoming ever more critical in our customers' decision-making, supporting demand for our strong expertise in data, infrastructure, and security. Microsoft's substantial investments in cloud and AI technologies, together with our partnership with Microsoft of more than 25 years, support our strategy and strengthen our ability to help customers take advantage of the latest technological innovations.
Key Figures
2025 |
2024 |
2023 |
2022 |
2021 |
|
|
Net sales, EUR thousand |
67,580 |
77,576 |
80,263 |
71,130 |
66,364 |
|
Operating profit before depreciation |
8,452* |
6,338 |
9,101 |
7,808 |
10,111 |
|
percentage of net sales |
12.5 % |
8.2 % |
11.3% |
11.0% |
15.2% |
|
Operating profit (EBIT), EUR thousand |
5,437 |
3,386 |
5,835 |
4,751 |
6,519 |
|
percentage of net sales |
8.0 % |
4.4 % |
7.3% |
6.7% |
9.8% |
|
Earnings before taxes, EUR thousand |
4,763 |
2,940 |
5,174 |
4,178 |
5,730 |
|
percentage of net sales |
7.0 % |
3.8 % |
6.4% |
5.9% |
8.6% |
|
Earnings, EUR thousand |
2,447 |
263 |
3,438 |
3,320 |
4,504 |
|
percentage of net sales |
3.6 % |
0.3 % |
4.3% |
4.7% |
6.8% |
|
Shareholders' equity, EUR thousand |
27,181 |
23,195 |
25,483 |
24,799 |
25,404 |
|
Interest bearing liabilities, EUR thousand |
4,438 |
4,342 |
6,325 |
14,349 |
9,818 |
|
Cash and cash equivalents, EUR thousand |
666 |
1,502 |
425 |
1,956 |
1,963 |
|
Deferred tax assets, EUR thousand |
49 |
293 |
2,415 |
4,090 |
4,830 |
|
Return on equity |
9.7 % |
1.1 % |
13.7% |
13.2% |
18.4% |
|
Return on investment |
18.5 % |
11.6 % |
18.0% |
14.5% |
20.6% |
|
Net Gearing |
23.1 % |
30.1 % |
36.1% |
50.0% |
30.9% |
|
Equity ratio |
52.1 % |
46.8 % |
48.3% |
44.8% |
51.1 % |
|
Balance sheet total, EUR thousand |
53,369 |
50,703 |
54,451 |
55,815 |
51,057 |
|
Research and development, EUR thousand |
5,278 |
5,558 |
5,108 |
4,153 |
3,504 |
|
percentage of net sales |
7.8 % |
7.2 % |
6.4% |
5.8% |
5.3% |
|
Personnel on average during the year |
535 |
571 |
578 |
536 |
516 |
|
Personnel at the end of the year |
507 |
546 |
581 |
564 |
500 |
*For 2025, the operating margin (EBITDA) includes a capital gain of EUR 0.9 million from the MMS business.
Annual Reports






Innofactor Plc Annual Report 2010.pdf (in Finnish)

Innofactor Plc Annual Report 2009.pdf (in Finnish)
Ownership
Innofactor is owned by:
- Ensio Investment Group Oy, the investment company of founder and CEO Sami Ensio
- CapMan Growth III Fund, managed by CapMan
- Mutual Pension Insurance Company Varma
- Osprey Capital, the investment company of Timo Larjomaa
- The company's executive management
- The company's personnel through Innofactor's Personnel Fund